Annual cycle of turbulence estimated from Seagliders
D. Gwyn Evans
, N. S. Lucas
, Victoria S. Hemsley
, Eleanor Frajka-Williams
, Adrian Martin
, Stuart C. PAinter
, Alberto C. Naveira Garabato
, Mark E. Inall
, Matthew R. Palmer
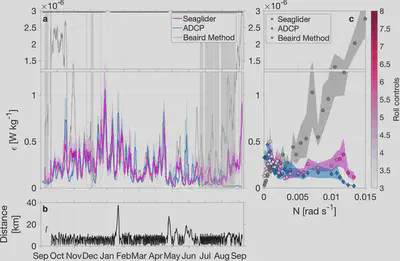
Seaglider-based rate of dissipation (magenta) compared to dissipation rate estimated using the ADCP-based structure function approach (blue) and the original Beaird et al. (2012) method to estimate dissipation from glider observations using a fixed 30 m high-pass filter (gray). Time series are smoothed using a 4-day running mean. The colored shading shows the 90% confidence interval determined using a Monte Carlo approach. The gray shading indicates periods of excessive glider roll maneuvers. An estimate of glider-based dissipation rate is flagged when the number of roll maneuvers in a given 20 m depth bin exceeds 6. The gray shading indicates periods in which more than half the data used to calculate the 4-day average is flagged. The horizontal black bars denote individual glider deployments. (b) Distance between the Seaglider and the ADCP. (c) Seaglider- and ADCP-based dissipation rates averaged into bins of buoyancy frequency, N. Each N-bin contains 100 glider observations. The color of the glider data points indicates the mean number of glider roll maneuvers. The colored shading shows the 90% confidence interval determined using a Monte Carlo approach. ADCP = acoustic Doppler current profiler.
I am a physical oceanographer who uses ocean observations to investigate ocean dynamics and circulation in a changing climate. I have a particular interest in problems spanning scales (from micro- to large-scale) or spheres (biogeosphere, cryosphere, atmosphere), and in methods that leverage traditional observations with new platforms and satellite data.