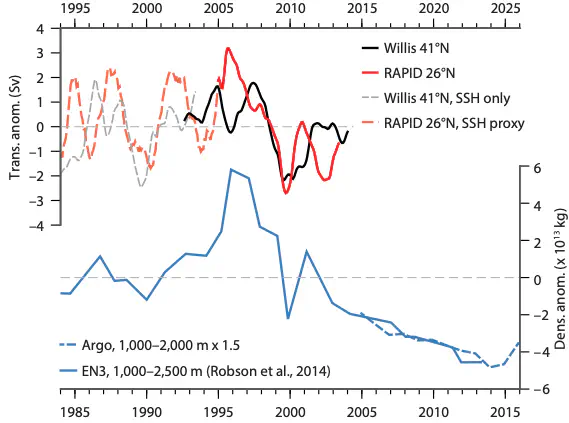
 Overturning transport anomalies at 26°N and 41°N after removing Ekman trans- ports. At 41°N, transports are estimated using Argo and altimetry (black line) and altimetry only (dashed gray line). At 26°N, transports are estimated from the RAPID array (solid red line) and altimetry (dashed pink line). The blue line shows the density anomaly integrated in the Labrador Sea between 1,000 m and 2,500 m from Robson et al. (2014), and the dashed blue line shows that anomaly estimated from Argo over 1,000 m to 2,000 m, then scaled by 3/2. The x-axis on the two plots is offset by 10 years to show a possible lagged response of transports to density changes.
Abstract
More than a decade of observations of the meridional overturning circulation in the subtropical North Atlantic show it to be highly variable on time scales of days to years and with an overall trend toward slowing down. Over the same time period, melting from Greenland (and elsewhere in the Arctic, including from sea ice) has been increasing, resulting in greater freshwater input to the northern North Atlantic. In this article, we examine evidence for the impact, if any, of this influx of freshwater on the large-scale ocean circulation and for potential changes.
Eleanor Frajka-Williams
Professor of Ocean Dynamics in a Changing Climate
I am a physical oceanographer who uses ocean observations to investigate ocean dynamics and circulation in a changing climate. I have a particular interest in problems spanning scales (from micro- to large-scale) or spheres (biogeosphere, cryosphere, atmosphere), and in methods that leverage traditional observations with new platforms and satellite data.