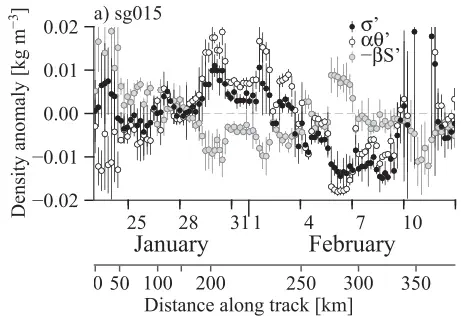
 Mean mixed-layer density anomaly for each profile (black) with the std devs (6) for the profile, calculated between the surface and 700 m, marked as a vertical bar for (a) sg015 and (b) sg014. Anomalies are calculated relative to u 5 3.58C, S 5 34.85, and s1 5 32.33 kg m23. Positive anomalies are less dense. Small std devs indicate a high degree 0 ofverticalhomogeneity.Thetemperaturecontributiontodensityau isgivenbytheblackopencircle,andthesalinity 0 contribution2bS bythegrayfilledcircle.Whenthesignsofthetemperatureandsalinitycontributionsareopposites, they are density compensating. When the sign of the temperature or salinity contribution is the same as the density anomaly, they are controlling the density.
Abstract
Deep convection—the process by which surface waters are mixed down to 1000 m or deeper—forms the primary downwelling of the meridional overturning circulation in the Northern Hemisphere. High-resolution hydrographic measurements from Seagliders indicate that during deep convection—though water is well mixed vertically—there is substantial horizontal variation in density over short distances (tens of kilometers). This horizontal density variability present in winter (January–February) contains sufficient buoyancy to restratify the convecting region to observed levels 2.5 months later, as estimated from Argo floating platforms. These results highlight the importance of small-scale heterogeneities in the ocean that are typically poorly represented in climate models, potentially contributing to the difficulty climate models have in representing deep convection.
Eleanor Frajka-Williams
Professor of Ocean Dynamics in a Changing Climate
I am a physical oceanographer who uses ocean observations to investigate ocean dynamics and circulation in a changing climate. I have a particular interest in problems spanning scales (from micro- to large-scale) or spheres (biogeosphere, cryosphere, atmosphere), and in methods that leverage traditional observations with new platforms and satellite data.