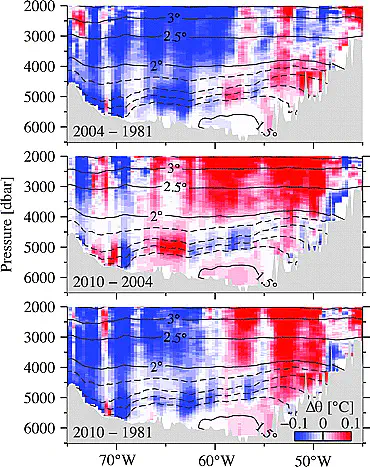
 Temperature changes between (a) 1981 and 2004, (b) 2004 and 2010, and (c) 1981 and 2010, calculated as modern minus older. Red regions indicate warming while blue regions indicate cooling. Temperatures were first gridded for each hydrographic section data onto a fine pressure-longitude grid before differencing. Isotherms contoured are the mean isotherm depths (in dbar) from the sections 1981, 1992, 1998, 2004, and 2010 at 0.5° intervals in solid black, and between 1.5°C and 2.0°C at 0.1°C intervals in dashed black.
Abstract
A recent hydrographic section at 24.5°N in the Atlantic and 6 months of observations from a moored array show that Antarctic Bottom Water (AABW), the densest and deepest water mass in the world oceans, has been warming. While Johnson et al. (2008) showed that northward AABW transport at 24.5°N has been declining from 1981 to 2004, suggesting that the lower cell of the overturning circulation could halt in the near future, estimates from the latest hydrographic section in 2010 indicate a partial recovery of northward AABW transport. From 6 months of temperature and salinity observations at a deep moored array at 24–26°N, we find that short-term variability between April and November 2009 is of the same magnitude as the changes observed from hydrographic sections between 1981 and 2004. These observations highlight the possibility that transport changes estimated from hydrographic sections may be aliased by short-term variability. The observed AABW transport variability affects present estimates of the upper meridional overturning circulation by ±0.4 Sv (1 Sv = 106 m3s−1).
Eleanor Frajka-Williams
Professor of Ocean Dynamics in a Changing Climate
I am a physical oceanographer who uses ocean observations to investigate ocean dynamics and circulation in a changing climate. I have a particular interest in problems spanning scales (from micro- to large-scale) or spheres (biogeosphere, cryosphere, atmosphere), and in methods that leverage traditional observations with new platforms and satellite data.